Dell OptiPlex Proprietary PSU Rant and Adapter Pinout
In our lab I am responsible for "IT Infrastructure", besides doing research of course. Since our lab is focused on high performance computing, this is quite a cool side job, since I get to play with bleeding edge hardware.
The problem is that this hardware, which is usually lent to us by vendors or industry partners, often comes in the form of a PCI Express card, not an entire machine. So I need to find a suitable box to put it in. In some cases this can be challenging, i.e., the Intel Xeon Phi needs a motherboard which is able to map PCIE address space above 4 GB --- there are very few motherboards which have this in their spec, even if they physically have the right connections (and work with a BIOS update) or even come with this support out-of-the-box. For GPUs it is usually easier, any motherboard will do, but of course to fully utilize the device it should have two 16x PCIE slots.
So when I had to set up a box with two Xeon Phis it was obvious that I had to build something myself: Ordered a nice Corsair box with a Xeon-Phi supporting MoBo, CPU, fan, RAM,... all in all at least an hour of selecting components an checking specs. When it arrived it was quite easy to put together due to the high quality of the components (esp. the case), but still some work. And after a while it started failing, because the 1000W Cooler Master PSU was faulty.
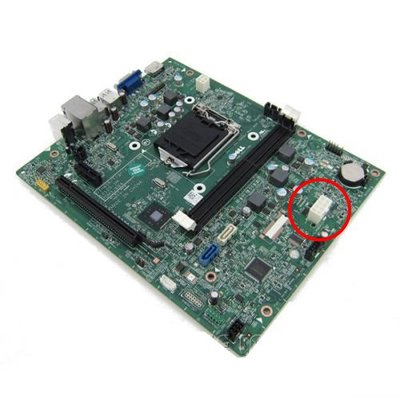
So when I was tasked to buy another box, this time for GPUs, I thought I could save a lot of time by just buying a finished PC from a local retailer, slapping in the K20s and be done with it. So I ordered an Dell OptiPlex 7020 from digitec.ch. According to the specs on the website it has two 16x PCIE slots, and it was the cheapest offer meeting that requirement. The PSU was mentioned in the specs as "standard 230W PSU". This will clearly not cut it if we put in two GPUs, to I also ordered a 700W PSU on top.
When the machine arrived, it was immediately clear that the GPUs would not fit because of the HDD cage. The HDD cage was spot-welded / riveted in place, so I used bolt-cutters to remove it, cutting my hand twice in the process. After that I attempted to change the PSU and to my dismay, the power connector on the motherboard is not one of those standard 22 or 26 pin ones, but has only eight pins, like some motherboards have for auxiliary power. But even though the standard 2x4 pin headers would fit, they might fry the board, as the default PSU clearly runs 5V to some of those pins! So the machine is completely unusable as sold --- the two 16x PCIe slots are next to useless if you don't have additional power for PCIe devices, but a PSU upgrade is next to impossible with this proprietary power plug on the motherboard. I am furious that Dell does such things --- I will never buy Dell again.
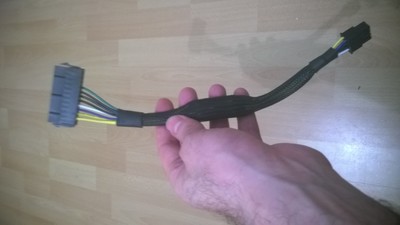
There is a solution though: You can order an adapter cable from moddiy.com. In their pictures it looks as if this is really just a cable without any active components. So I tried figuring out a mapping between pins with a multimeter, cut off the old cable and tried by fiddling cut cables into an ATX power connector (do not try this at home, use your office, they have fire insurance - I guess), but to no avail. So I ordered the cable and took it apart:
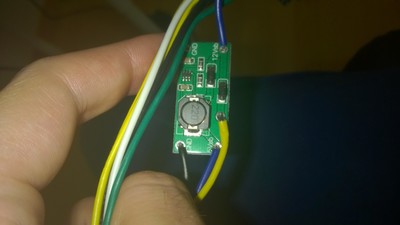
The trick is that the Dell motherboard uses a 12V standby supply, while ATX specifies 5V. The cable from moddiy uses a circuit that looks like a step-up converter to provide those 12V.
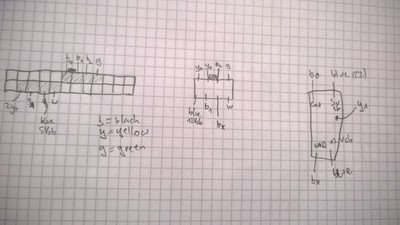
The pinout is shown below (showing the male connectors).
Downloading Flash Videos
A friend of mine asked me if I could download a flash video for her that was aparently not downloadable with the firefox plugins that can normally be used for this. As it was weekend and I wanted to know how this flash stuff works anyway, i started to poke arround a bit. I figured that the flash player embedded into the site had to store the video somewhere. And as the video was nearly three hours long I was certain it was using a file to store the video instead of doing it in memory. Strangely there was noting in /tmp or /var or that looked like video data. Lets have a closer look using strace:strace -tt -o firefox_strace.txt -f firefox http://engkino....If we grep in the file for open syscalls in the /tmp folder, only one thing pops up - strangely the very same file gets deleted an instant later!
153321-8012  19:31:33.809867 read(5, "!", 1)   = 1
153322-8012  19:31:33.810021 write(6, "!", 1)  = 1
153323:8012  19:31:33.810297 open("/tmp/FlashXXGqccIP", O_RDWR|O_CREAT|O_EXCL, 0600) = 15
153324-8012  19:31:33.810479 close(15)         = 0
153325-8012  19:31:33.810564 stat("/tmp", {st_mode=S_IFDIR|S_ISVTX|0777, st_size=12288, ...}) = 0
153326:8012  19:31:33.810720 open("/tmp/FlashXXGqccIP", O_RDWR|O_CREAT|O_TRUNC, 0666) = 15
153327-8012  19:31:33.810835 unlink("/tmp/FlashXXGqccIP") = 0
153328-8012  19:31:33.810984 read(12, 0x7f233b791074, 4096) = -1 EAGAIN (Resource temporarily unavailable)
Aparently the file /tmp/FlashXXGqccIP is opened (and created if it does not
exist) (line 153323) then closed, then opened again, beeing truncated to zero
bytes. A few microseconds after that it is deleted! That is a cool mis-use of
the semantics of linux (POSIX?) files: unlink() deletes the name which refers
to a file, however, any file descriptor referring to that file is still valid.
So the filedescriptor 15 can still be used by the process. And indeed, it seems
to be used to store binary data which is also read back from time to time.
264717-8022  19:32:16.903338 read(15, "\326\351Sd\212h\260G\227\210\366\326\242\330"..., 4040) = 4040
264718:8022  19:32:16.903623 write(15, "r0\32\24 #\305\355\22\31\270\236"..., 4096) = 4096
264719:8022  19:32:16.904525 write(15, "\320\27('31\202)\366\364\0\262K\241\5"..., 248 unfinished ...
264761-8022  19:32:16.905365 read(15, "O\277\312\Z\360L!\353\202\374\233\r"..., 4096) = 192
So how can we get the file? Of course we could use LD_PRELOAD trickery to
intercept the read calls, but that would be very messy. Linux offers a much
easier way to access all open file descriptors opened by a process. We can
check the process id of the flashplayer process, and get a symlink to the file
from the proc filesystem: ls -l /proc/8427/fd | grep tmp gives us:
lrwx------ 1 timos timos 64 Feb 12 20:11 15 -> /tmp/FlashXXvX2DEE (deleted)We can use that symlink to copy the file to our home directory.
Alternativlos, Fun with GNU R
Frank Rieger and Felix von Leitner started to make a Podcast called "Alternativlos" that I like to listen to. Lately I was wondering when the next issue would come out or if they lost interest in producing episodes --- I felt that the delay between episodes was constantly growing.
However, the problem with such "feelings" is that they can be misleading. So I decided to investigate a little using my favorite data analysis tool GNU R.
I used the R code below to download the website which contains the release date and an abstract for each episode. The content is then piped through a perl snipped which extracts the episode numbers and release dates. Then R calculates the difference between successive releases and plots them. Also a moving average is plotted.
svg(filename="alternativlos_issue_freq.svg");
data <- read.table(
  pipe("wget 'www.alternativlos.org' -q -O - |
  perl -n -e \'if (m/Folge (\\d+) vom (.+?)</) {print \"$1 $2\n\";}\'")
);
data <- data[order(data$V1),];
dates <- as.Date(data$V2, "%d.%m.%Y");
dates <- append(dates, Sys.Date());
dates_before <- dates[1:length(dates)-1];
dates_after <- dates[2:length(dates)];
days_between <- dates_after - dates_before;
plot(x=seq(2, length(days_between)+1), y=days_between, type="b",
     xlab="Issue", ylab="Time between issues [d]", lwd=2, col="red",
     main="Alternativlos Podcast Issue Frequency",
     ylim=c(min(days_between), max(days_between)+5)
);
ma5 = filter(days_between, rep(1/5, 5), sides=2);
lines(x=seq(2, length(days_between)+1), y=ma5, lwd=3, col="blue");
grid();
legend("topleft", lwd=c(2,3), col=c("red", "blue"), bg="white",
       legend=c("Alternativlos Issues", "Moving Average (over 5 Issues)")
);
dev.off();

From the data we can observe that in the beginning of the podcast a new episode was released about every 2 weeks on average, while the average waiting time is now more than one month. Gnaa. So let's all hope there will be a mew episode soon. Note that the script assumes that the next issue will come out today.
And if you have to do some kind of statistical data analysis or just have to make some graphs then I highly recommed trying GNU R. When I wrote my first scientific articles I made a my graphs with gnuplot. This worked nicely until I wanted to put slightly more "advanced" stuff in my graphs. Some things are just impossible with gnuplot and I noticed that gnuplot added or changed features in minor versions. So if I worked with other people we always had to ensure that everybody uses exactly the same gnuplot version. With R I have never encountered an "unsolvable" visualization problem, the documentation is excellent and if I can not find a solution for my problems by myself the R-help mailing list members have good suggestions within minutes.